Creative Statement:
There are those who see Planet Earth as a gigantic living being, one that feeds and nurtures humanity and myriad other species – an entity that must be cared for. Then there are those who see it as a rock full of riches to be pilfered heedlessly in a short-term quest for over-abundance. This ‘cradle to grave’ mentality, it would seem, is taking its toll (unless you’re a virulent disbeliever in climate change). Why not, ask artists Priscilla Bracks and Gavin Sade, take a different approach? To this end they have set out on a near impossible task; to visualise the staggering quantity of carbon produced by Australia every year.
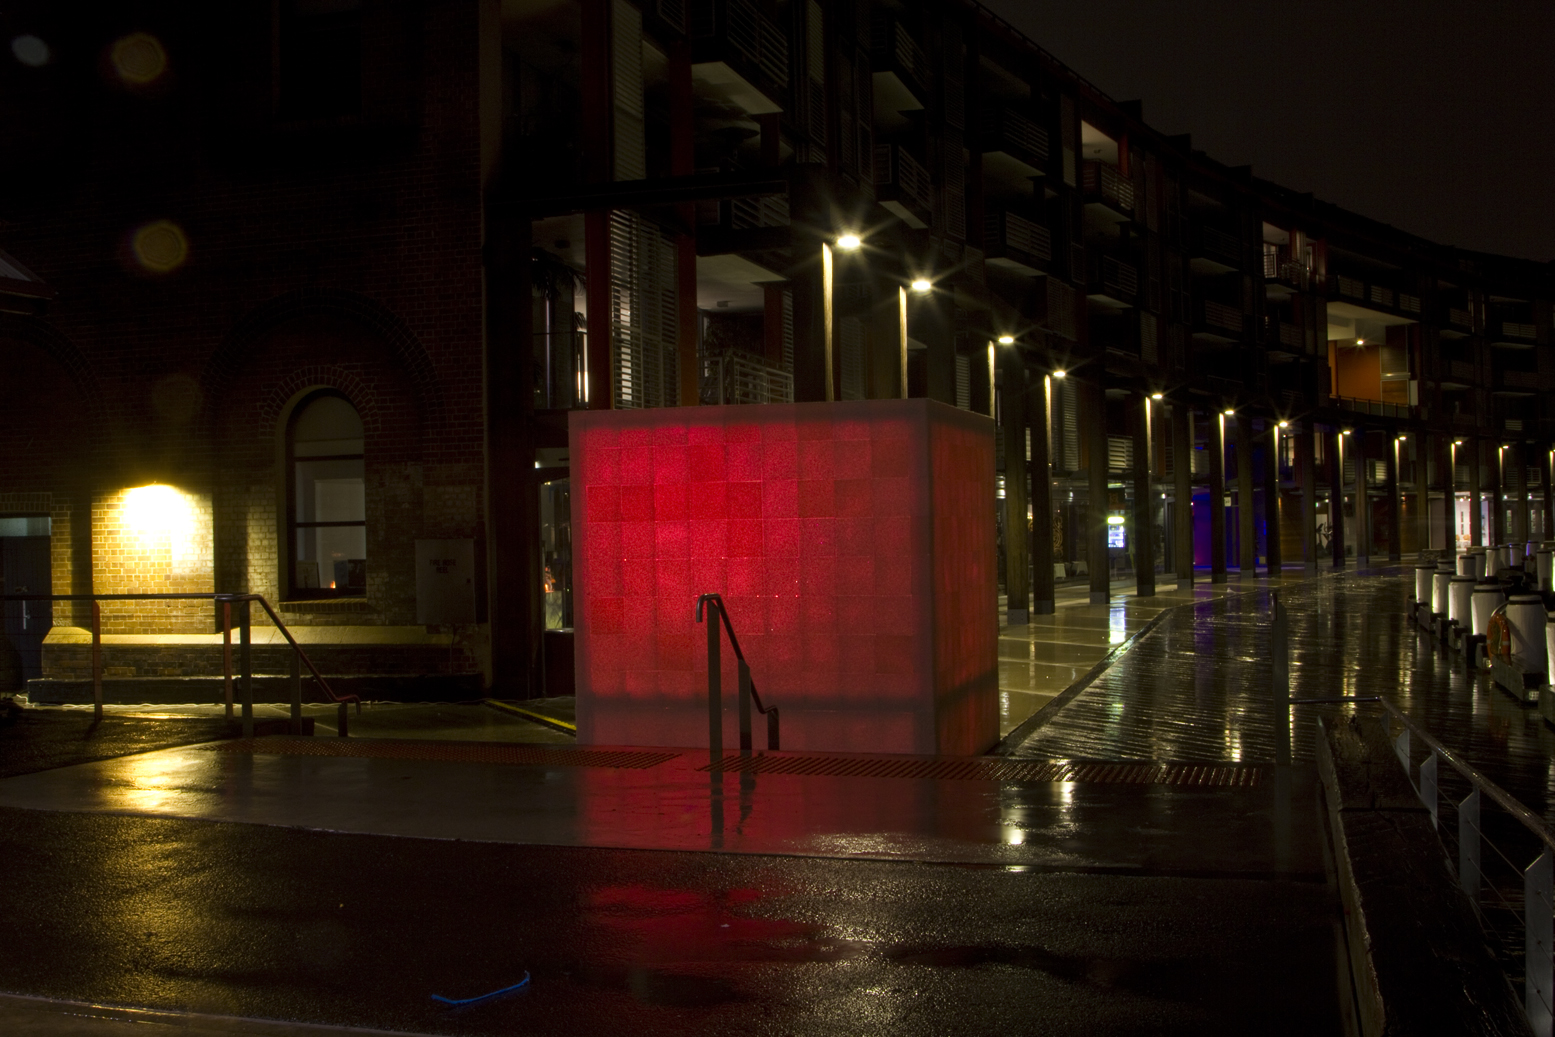
Their eerie, glowing plastic cube resembles something straight out of Dr Who or The X Files. And, like the best science fiction, it has technical realities at its heart. Every One, Every Day tangibly illustrates our greenhouse gas output – its 27m3 volume is approximately the amount of green-house gas emitted per capita, daily. Every One, Every Day is lit by an array of LED’s displaying light patterns representing energy use generated by data from the Australian Energy Market.
Every One, Every Day was formed from recycled, polyethylene – used milk bottles – ‘lent’ to the artists by a Visy recycling facility. At the end of the Vivid Festival this plastic will be returned to Visy, where it will re-enter the stream of ‘technical nutrients.’
Could we make another world? One that emulates the continuing cycles of nature? One that uses our ‘technical nutrients’ such as plastic and steel in continual cycles, just like a deciduous tree dropping leaves to compost itself and keep it’s roots warm and moist?
Ashleigh Crawford. Melbourne – April, 2013

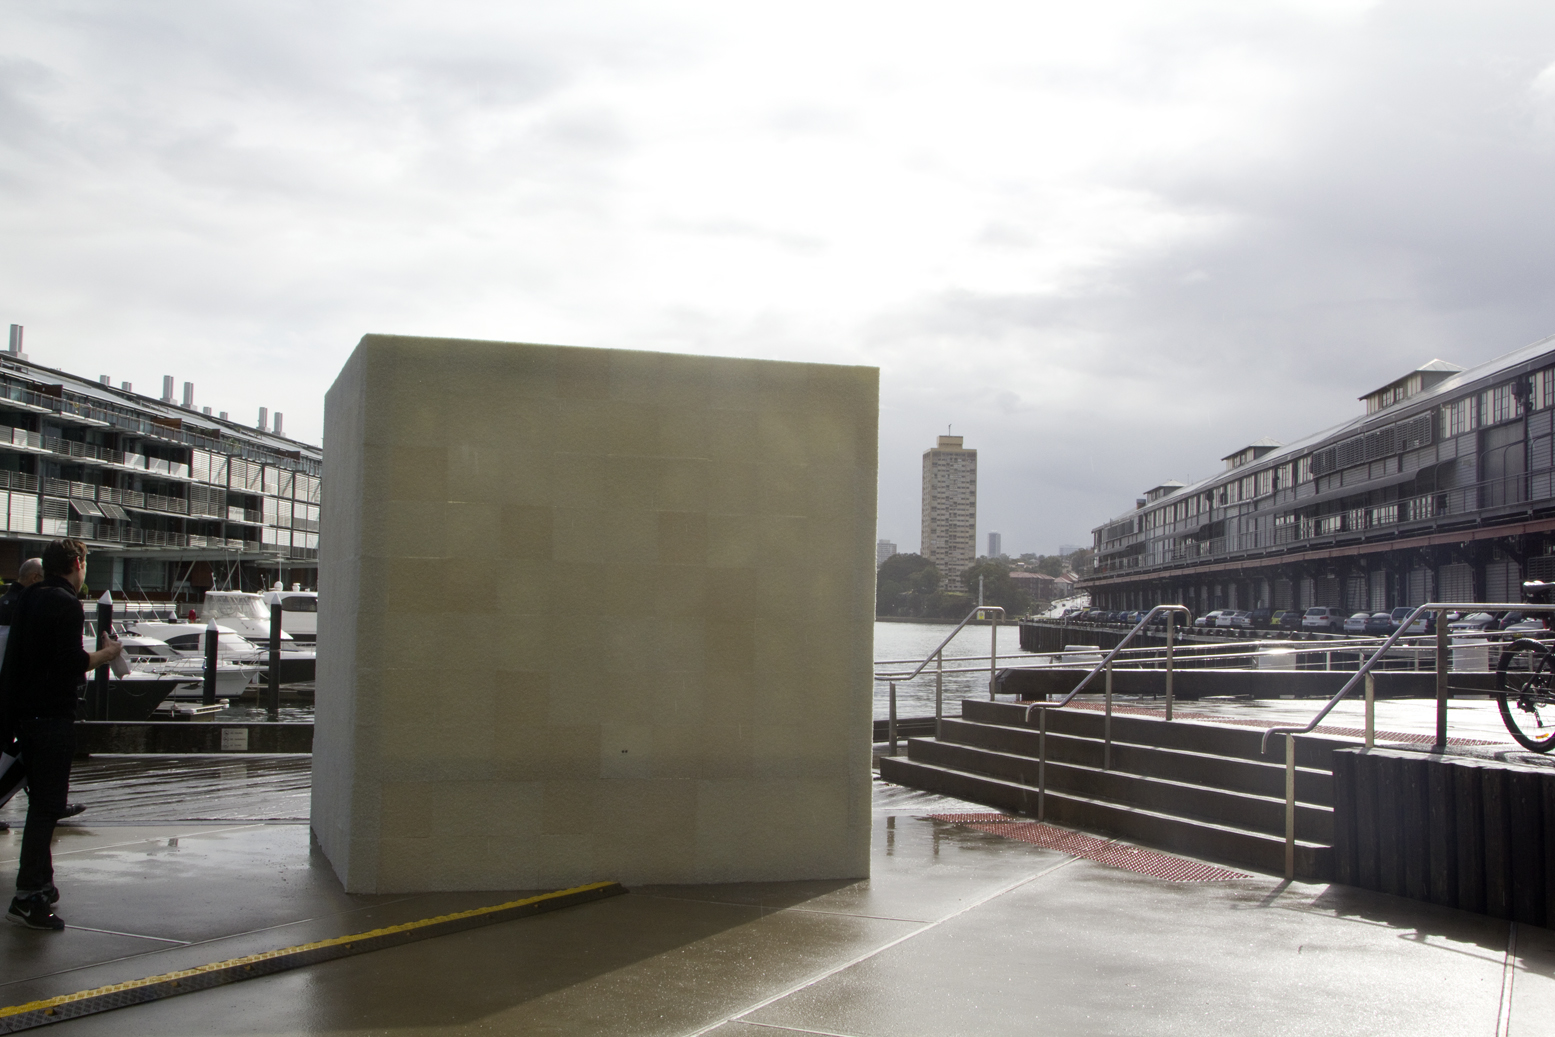
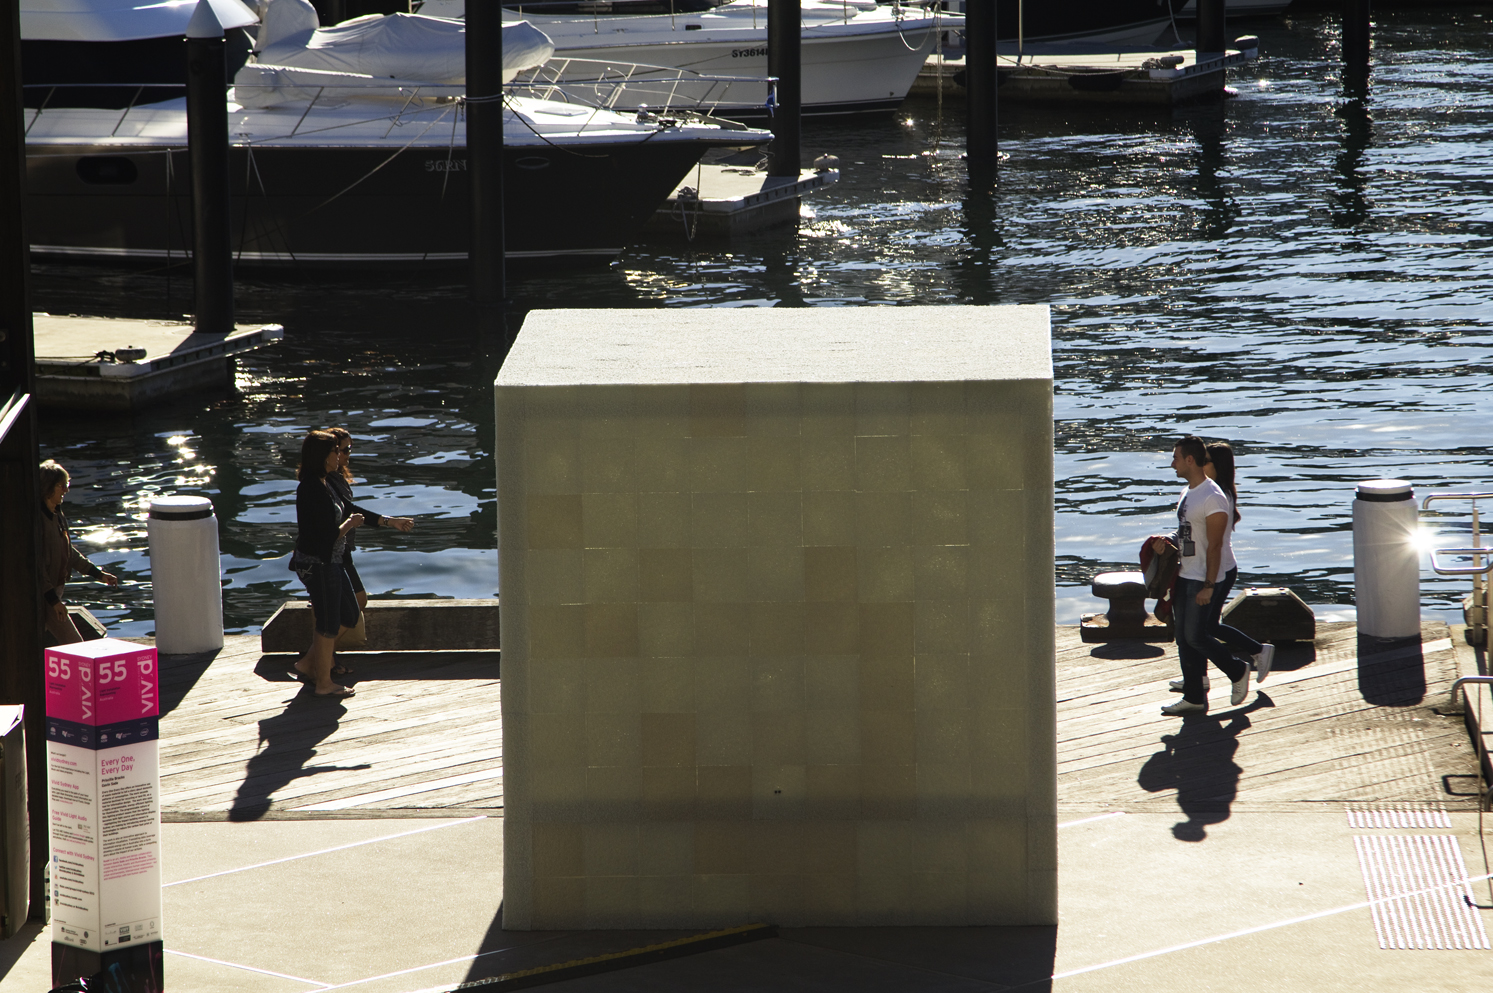
Every One, Every Day at Vivid Sydney Walsh Bay 2013
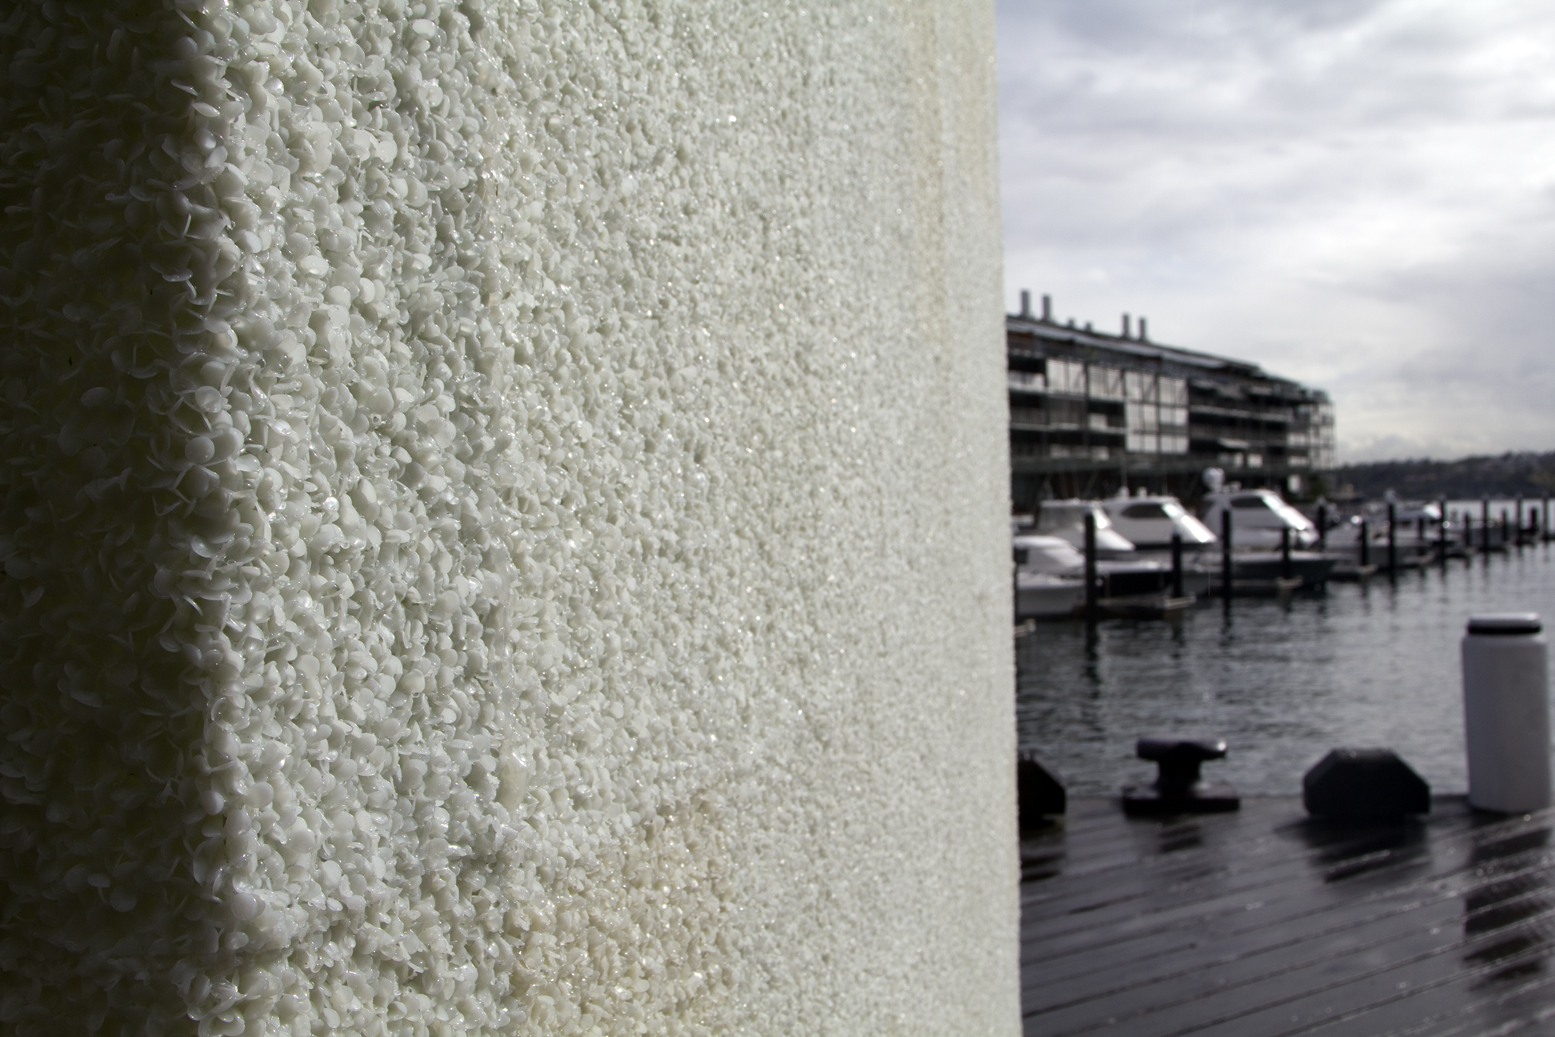
Every One, Every Day by Day, at Vivid Sydney Walsh Bay 2013. The surface of the work is clad in tiles made from polyethylene provided by Visy. The tiles were moduled by Rotadyne. The process of making the tiles resulted in a unique tactile surface.
Every One, Every Day by Night, at Vivid Sydney Walsh Bay 2013. The illumination patterns and colours are derived from Australian Energy Market, warm orange hues representing peak demand, with blue hues lower demand. Spikes in the price trigger white flashes.

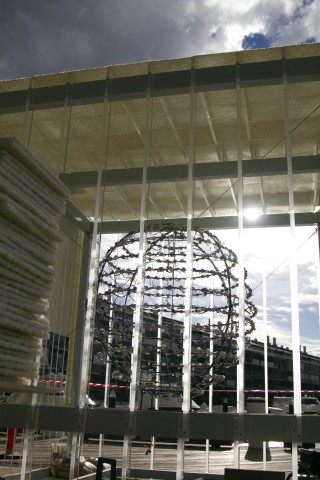
Every One, Every Day. Construction at Vivid Sydney Walsh Bay 2013. The cube is illuminated by a sphere of 600 Color Kinetics iColor Flex LMX LED nodes provided by Xenian living light. The work was built by Acron Building Services.
Data and Visualisation
In 2012, Australia’s population of (then) 22.6 million people emitted approximately 546.1 million tones[1] of equivalent CO2[2]. This is a complex statistic to visualise and comprehend.
Every One, Every Day is a cube with a volume of 27 cubic meters. The annual per capita emissions figures for Australia are cited as ranging between 18 to 25 tons. Assuming the lower figure, 18tons per capital annually, the 27 cubic meters represents approximately one day of CO2 emissions – where CO2 is a gas at 15C and 1 atmosphere of pressure. CO2 is solid at -78.5C and 1 atmosphere – thus the 27m3 volume represents approximately 42tons of solid CO2 – per capita this is produced in 2.3 years (again assuming the lower annual per capital emission figure of 18t).
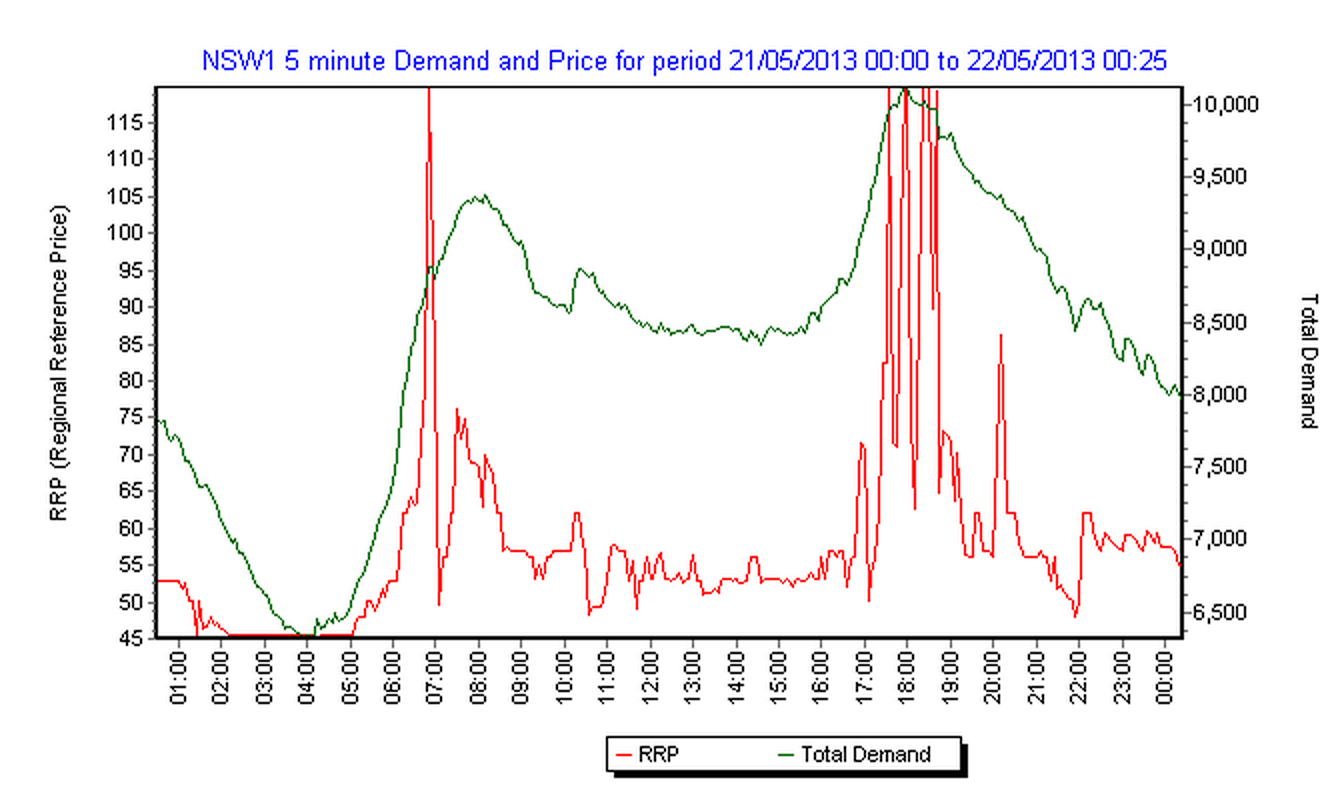
The illumination patterns are derived from a data feed from the Australian Energy Market, using the dispatch interval price and demand graph for New South Wales – pictured below for the 21st to 22rd of May. The graph below shows two peaks in the day, one in the morning around 8AM and a second larger peak around 6PM, with demand falling to a low at 4AM.
Exhibitions
- Vivid Festival of Light Sydney 2013
Credits
Every One, Every Day is a Kuuki Production, and was realised by:
Artists: Priscilla Bracks and Gavin Sade
Programming: Glen Wetherall
Metal work: Remo Vallance
Construction: Acron Building Services
Engineering: Built Environment Collective
Sponsors
Made with Processing and Philips ColorKinetics.
[1] This figure is from the Quarterly Update of Australia’s National Greenhouse Gas Inventory: September 2012 and is the figure for year to September 2012, excluding Land use, Land-use change and Forestry. See: http://www.climatechange.gov.au/publications/greenhouse-acctg/national-greenhouse-gas-inventory-2012-09.aspx
[2] CO2 equivalent (or CO2-e) is a measure of all green house gas emissions that would cause the same warming as the equivalent volume of CO2. Thus the CO2-e includes all methane, perfluorocarbons, and nitrous oxide emissions data.

